Safer Streets Littleton: Pilot Projects
The City of Littleton is committed to making our streets safer for everyone—whether you walk, bike, roll, or drive. As part of Safer Streets Littleton and the Neighborhood Traffic Calming Program, the city installs pilot projects to improve safety and mobility in neighborhoods like yours. This webpage will be regularly updated with the latest pilot project details.
Why are these changes coming to your community?
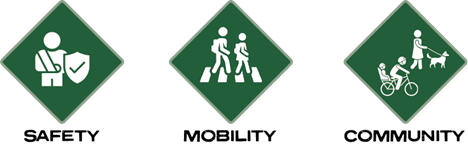
SAFETY: The City of Littleton is focused on reducing crashes and preventing serious injuries by implementing proven safety measures, such as speed cushions, improved crossings, and better visibility at intersections. These projects allow the city to address safety concerns quickly and evaluate their effectiveness.
MOBILITY: Whether you walk, bike, roll, or drive, our streets should work for everyone. These projects help improve access and connectivity, making it easier and safer to get where you need to go, no matter your mode of transportation.
COMMUNITY: Streets are more than just roads. They are shared spaces that connect our neighborhoods. By making strategic improvements, the city aims to create safer, more comfortable places that encourage walking, biking, and gathering, ultimately enhancing quality of life in Littleton.
What is a Pilot Project?
The city defines a pilot project as a traffic calming intervention that uses modular materials to test, evaluate, and refine a design before investing in permanent installation. Modular materials allow the city to address safety concerns on local and neighborhood streets quicker by using materials that can be moved or swapped instead of poured concrete.
Pilot to Permanent
After pilot projects are installed, staff evaluate their performance to understand whether the countermeasures are improving safety and meeting project goals. Staff use this information to make design adjustments to improve performance if needed and determine whether a pilot project is meeting the criteria to move forward toward a future permanent installation. A summary of evaluation results and decisions will be published on this webpage to maintain transparency and accountability.
Evaluation of the projects includes:
- Post-installation vehicle speeds and volume data (typically at least 3 months post-installation).
- Reviews of operational considerations, such as access, visibility, emergency response, and snow plowing.
- Community feedback from a public survey.
Permanent Construction Criteria
A pilot project may be considered for permanent installation when the following criteria are met:
- Speed and/or volume data show significant and consistent safety improvements.
- The design functions well operationally and does not create new safety concerns.
- The design aligns with long-term corridor plans and available funding.
|
Installed Projects
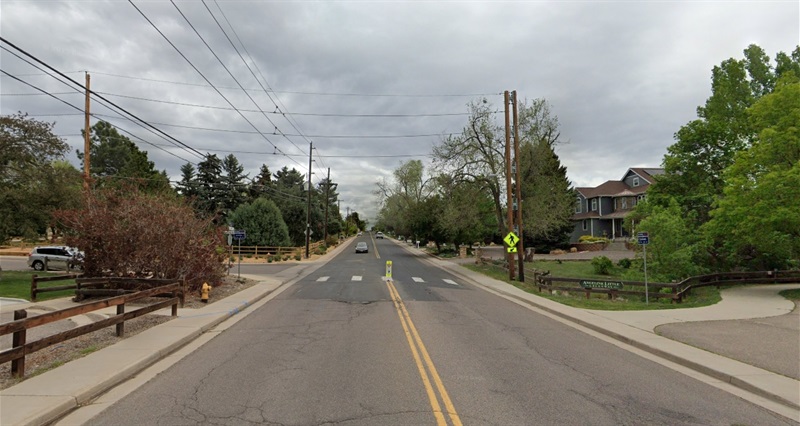
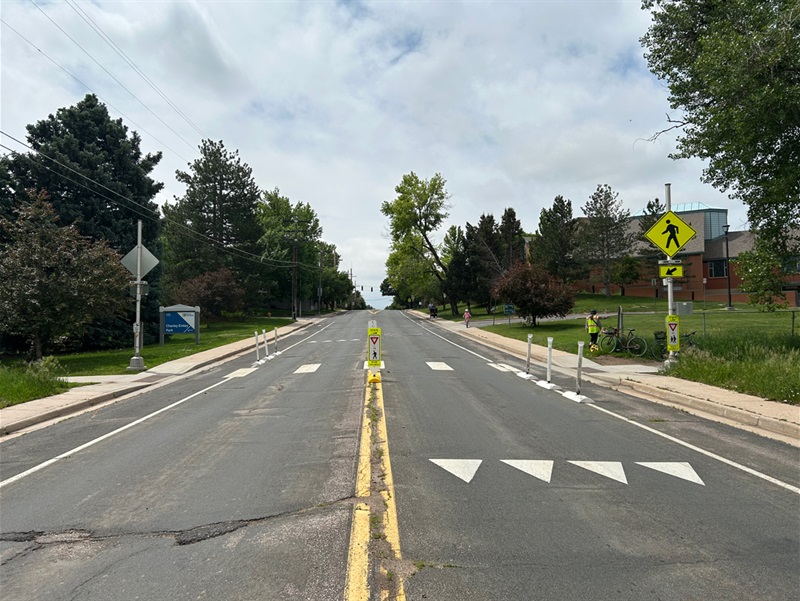
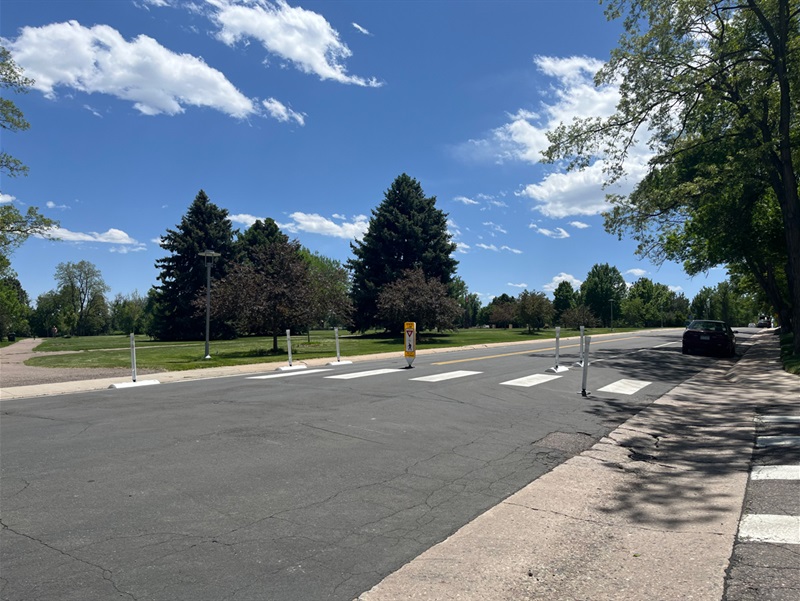
Elati Street & Arapahoe Road/Briarwood Avenue
Project Area Map

Existing Conditions

Data Summary
Street Type: Neighborhood Connector
Speed Limit: 25 MPH
Average Daily Traffic (ADT): 1,666
85th Percentile Speed: 31 MPH
Serious Injury and Fatal Crashes since 2022: 1
Planned Improvements
Installation of bike lane green conflict paint through the intersection for visibility of bike riders and modifying delineator quantities based on field observations and community feedback.
Construction Timeline
Installed Fall 2025
Upcoming Projects
Caley Avenue & Datura Street
Project Area Map

Existing Conditions
Data Summary
Street Type: Neighborhood Connector/Local
Speed Limit: 25/30 MPH
Average Daily Traffic (ADT): 4,307
85th Percentile Speed: 32 MPH
Serious Injury and Fatal Crashes since 2022: 0
Planned Improvements
Installing speed cushions, curb extensions, and in-street pedestrian crossing signage to reduce speeds and increase crosswalk compliance.
Construction Timeline
Spring 2026
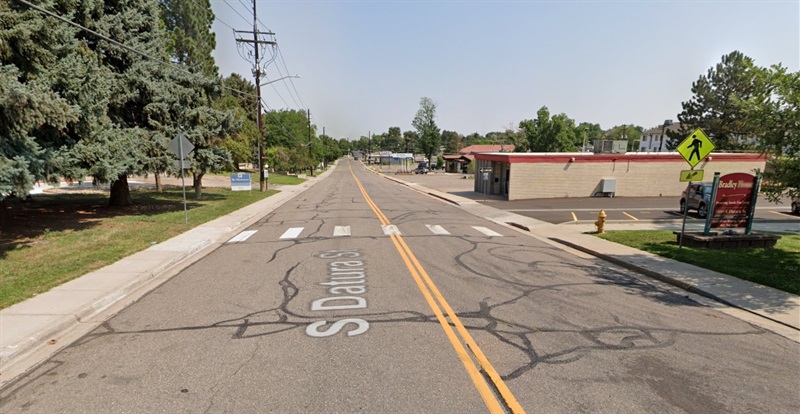
Datura Street
Project Area Map

Existing Conditions
Data Summary
Street Type: Local
Speed Limit: 30 MPH
Average Daily Traffic (ADT): 1,083
85th Percentile Speed: 33 MPH
Serious Injury and Fatal Crashes since 2022: 0
Planned Improvements
Installing speed cushions, curb extensions, and in-street pedestrian crossing signage to reduce speeds and increase crosswalk compliance.
Construction Timeline
Spring 2026
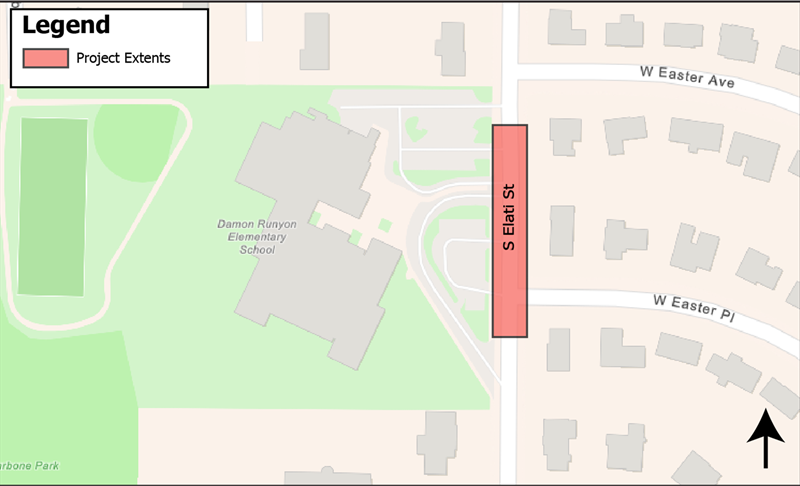
Elati Street at Runyon Elementary
Project Area Map
Existing Conditions

Data Summary
Street Type: Neighborhood Connector
Speed Limit: 25 MPH
Average Daily Traffic (ADT): 1,806
85th Percentile Speed: 30
Serious Injury and Fatal Crashes since 2022: 0
Planned Improvements
Installing speed cushions, curb extensions, and in-street pedestrian crossing signage to reduce speeds and increase crosswalk compliance.
Construction Timeline
Spring 2026
Fremont Avenue & High Line Canal Trail
Project Area Map
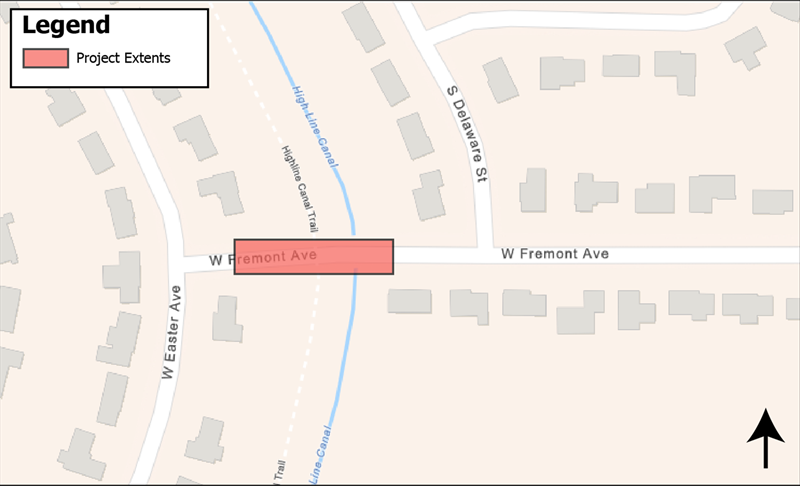
Existing Conditions
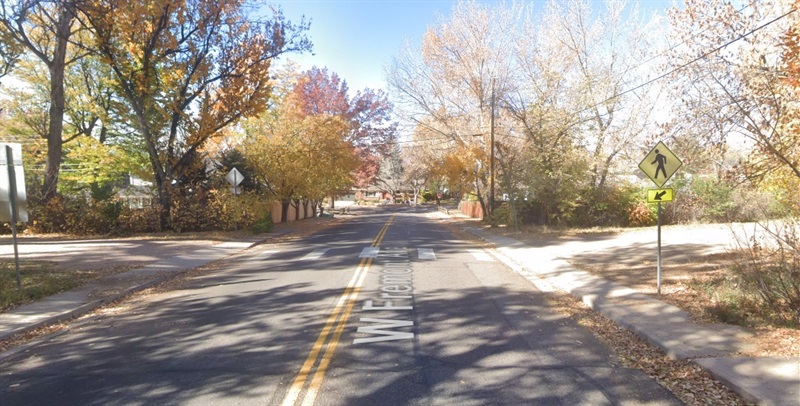
Data Summary
Street Type: Neighborhood Connector
Speed Limit: 25 MPH
Average Daily Traffic (ADT): 2,672
85th Percentile Speed: 20
Serious Injury and Fatal Crashes since 2022: 0
Planned Improvements
Installing curb extensions, and in-street pedestrian crossing signage to reduce speeds and increase crosswalk compliance.
Construction Timeline
Spring 2026
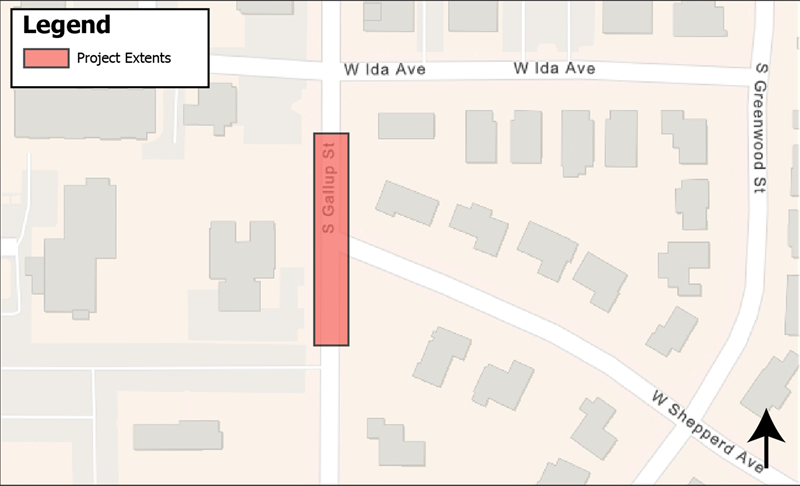
Gallup Street & High Line Canal Trail
Project Area Map
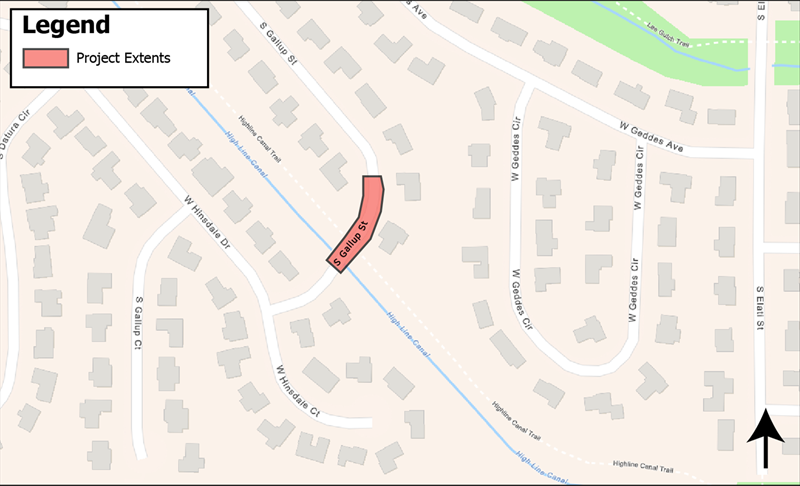
Existing Conditions

Data Summary
Street Type: Local
Speed Limit: 25 MPH
Average Daily Traffic (ADT): 159
85th Percentile Speed: 28
Serious Injury and Fatal Crashes since 2022: 0
Planned Improvements
Installing speed cushions, curb extensions, and in-street pedestrian crossing signage to reduce speeds and increase crosswalk compliance.
Construction Timeline
Spring 2026
Ridge Road & Apache Street
Project Area Map

Existing Conditions
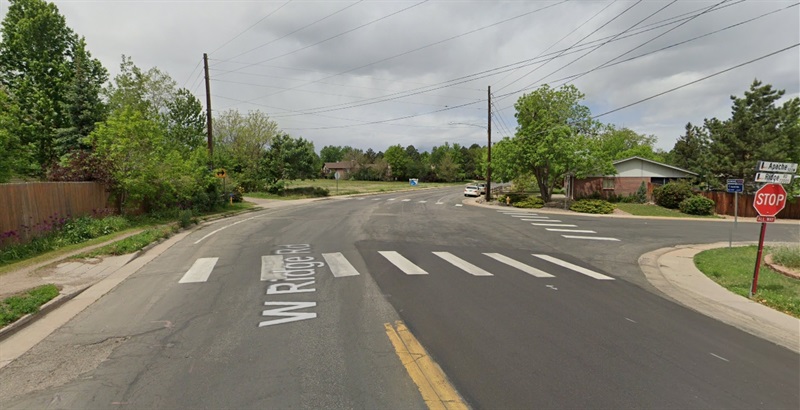
Data Summary
Street Type: Neighborhood Connector/Local
Speed Limit: 30 MPH
Average Daily Traffic (ADT): 2,743
85th Percentile Speed: 32
Serious Injury and Fatal Crashes since 2022: 0
Planned Improvements
Installing curb extensions and in-street pedestrian crossing signage to reduce speeds and increase crosswalk compliance. Bike lane protection along the east-bound intersection to connect with the High Line Canal Trail.
Construction Timeline
Spring 2026
Upcoming Revisions
Lake Avenue & Spotswood Avenue/Sterne Parkway
Project Area Map

Existing Conditions

Data Summary
Street Type: Neighborhood Connector
Speed Limit: 30 MPH
Average Daily Traffic (ADT): 1,315
85th Percentile Speed: 26 MPH
Serious Injury and Fatal Crashes since 2022: 0
Planned Improvements
Upgrading curb extensions by replacing portions of existing materials with Zipper curbing for improved durability and visibility.
Construction Timeline
Spring 2026
Lowell Boulevard & Arrowhead Road
Project Area Map

Existing Conditions
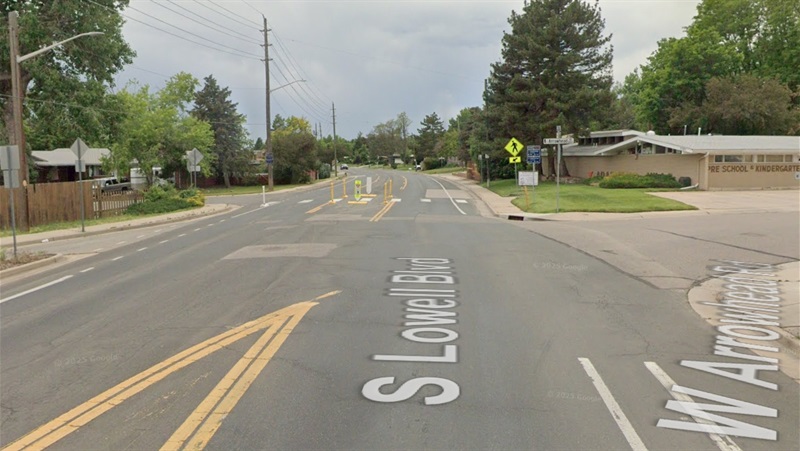
Data Summary
Street Type: Neighborhood Connector
Speed Limit: 30 MPH
Average Daily Traffic (ADT): 6,000
85th Percentile Speed: 37 MPH
Serious Injury and Fatal Crashes since 2022: 0
Planned Improvements
Installing speed cushions to reduce speeds and in-street pedestrian crossing signage on a raised curb to increase crosswalk compliance.
Construction Timeline
Spring 2026
Prince Street & Lee Gulch Trail Crossing
Project Area Map
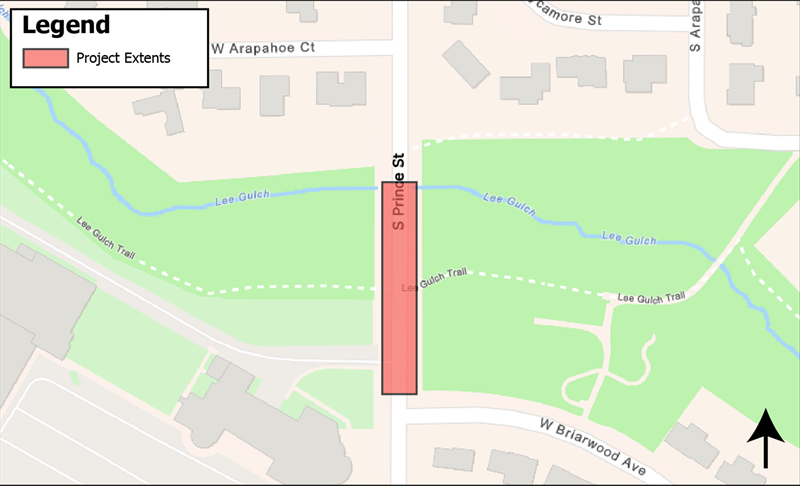
Existing Conditions
Data Summary
Street Type: Neighborhood Connector
Speed Limit: 30 MPH
Average Daily Traffic (ADT): 2,834
85th Percentile Speed: 38 MPH
Serious Injury and Fatal Crashes since 2022: 0
Planned Improvements
Installing speed cushions to reduce speeds and in-street pedestrian crossing signage on a raised curb to increase crosswalk compliance.
Construction Timeline
Spring 2026
Shepperd Avenue & Gallup Street
Project Area Map
Existing Conditions
Data Summary
Street Type: Mixed Used Downtown Connector/Neighborhood Connector
Speed Limit: 30 MPH
Average Daily Traffic (ADT): 2,444
85th Percentile Speed: 33 MPH
Serious Injury and Fatal Crashes since 2022: 0
Planned Improvements
Installing speed cushions to reduce speeds and in-street pedestrian crossing signage on a raised curb to increase crosswalk compliance.
Construction Timeline
Spring 2026
Sterne Parkway & Littles Creek Park
Project Area Map

Existing Conditions

Data Summary
Street Type: Neighborhood Connector
Speed Limit: 25 MPH
Average Daily Traffic (ADT): 1,401
85th Percentile Speed: 32 MPH
Serious Injury and Fatal Crashes since 2022: 0
Planned Improvements
Upgrading existing layout of materials with additional curb extensions to increase crossing compliance and slow speeds.
Construction Timeline
Spring 2026
Windermere Street & Lee Gulch Trail Crossing
Project Area Map

Existing Conditions

Data Summary
Street Type: Neighborhood Connector
Speed Limit: 30 MPH
Average Daily Traffic (ADT): 1,661
85th Percentile Speed: 35 MPH
Serious Injury and Fatal Crashes since 2022: 0
Planned Improvements
Installing speed cushions to reduce speeds and in-street pedestrian crossing signage on a raised curb to increase crosswalk compliance.
Construction Timeline
Spring 2026
View the Pilot Projects map
Past Projects
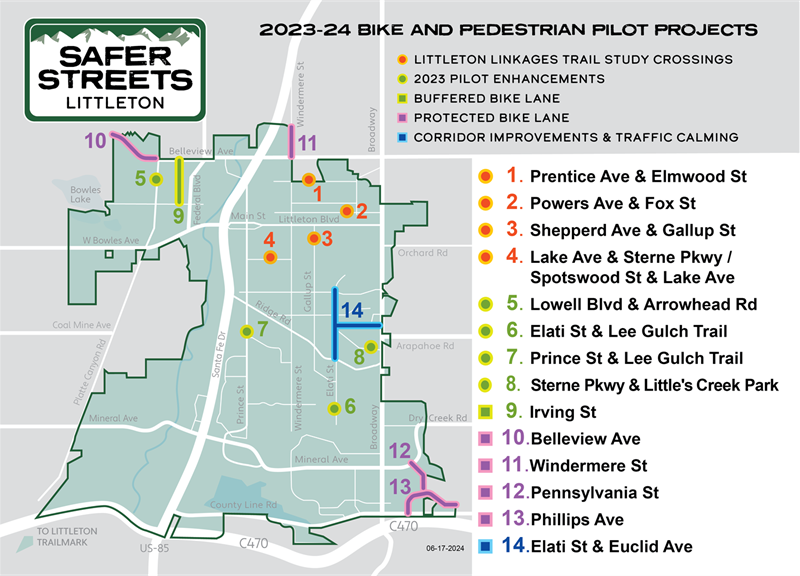
2024 Pilot Projects
Littleton's Public Works team installed numerous pilot projects geared toward bike and pedestrian safety in summer 2024, allowing them to test methods and materials for wider implementation going forward as part of the Safer Streets Littleton campaign. Pilot projects include:
- Four trail-crossing improvements identified by the 2023 Littleton Linkages trail study, on the borders of Cornerstone, Ketring, Powers, and Sterne Parks. Crossings feature new crosswalks and "bulb-out" areas, which extend the curb at an intersection to shorten the crossing distance and improve visibility for pedestrians.
- Four lane-miles of protected bike lanes along Belleview Avenue, Windermere Street, Pennsylvania Street, and Phillips Avenue. These are the first protected bike lanes in Littleton, adding physical barriers between riders and traffic – a step up from “buffered” bike lanes which demarcate a wide area between traffic lanes and bike lanes. These projects allow planners and engineers to test different types of barriers and how they impact not just rider safety but maintenance needs like street sweeping, snowplowing, and drainage.
- Reevaluation of pilot projects installed in 2023, including trail crossings, bikeway, and intersection enhancements. Existing projects will see further improvements based on data collection over the previous year, including stronger traffic calming measures in areas where speeding remains an issue.
- Pedestrian improvements in the area surrounding Euclid Middle School, including new crosswalks, bulb-outs, and signage upgrades.
Additional Resources
Glossary
Traffic Calming Terms
Vertical Protection
- Delineator: A flexible, plastic post that is between 2 to 4ft tall and bolted into the roadway or on top of a temporary curb to provide a clear visual signal to drivers that a space is not meant for vehicles. Also called flex post or plastic bollard.
- Temporary Curb: A durable, plastic curb that is raised on both sides and is bolted to the road. These are typically installed with delineators on top of them.
Slow Speeds
- Bulb-out: Delineators and temporary curb are used to extend the corner of the curb at an intersection out into the street and shorten the crossing distance for pedestrians while reducing vehicle turning speeds.
- Chicane: A combination of two or more alternating bulb-outs placed mid-block to slow vehicle speeds by narrowing and realigning the roadway.
- Pinch-point: Delineators and temporary curb are used mid-block to extend the curb space and narrow the roadway to slow down vehicle traffic and provide a safer crossing on low-volume streets.
Safe Pedestrian Crossings
- Advanced pedestrian signs: Traffic signs are placed before crosswalks or pedestrian areas like school zones to alert drivers to the presence of pedestrians and encourage them to slow down and yield.
- In-street crossing signs: Pedestrian traffic signs that are placed within the roadway at a crosswalk to increase driver awareness and visibility of pedestrians, often helping to slow traffic through crosswalks.
Additional Strategies
- Daylighting: Delineators and temporary curb are used to restrict drivers from parking at intersections and adjacent to crosswalks to provide visibility for crossing pedestrians.
- Short-term striping: Low-cost paint is used that fades in about 9 to 12 months.
Other Terms
Street Types
- As defined in the 2019 Transportation Master Plan, street types factor in the typical functional classification system while also accounting for the surrounding land use intensity and character which affect the street’s operation and design.
- See Transportation Master Plan(PDF, 14MB), page 40 and page 125, for more details
Average Daily Traffic (ADT)
- Average daily traffic (ADT) is the number of vehicles that pass a given point on a road during a specific time period.
- The City collected ADT through various methods including tube counters, radar counters, and in-person observations.
85th Percentile Speed
- The speed at or below which 85% of drivers travel on a road.
- The 85th percentile speed is typically taken from speed data collected during a 24-hour weekday period.
Serious Injury and Fatal Crashes
- A fatal injury is any injury that results in death within 30 days of the reported crash.
- A serious injury is any injury other than a fatal injury which prevent the injured person from walking, driving, or normally continuing the activities they were capable of performing before the crash occurred.
FAQs
Why was my street chosen for one of these projects?
- The City selects locations for Safer Streets Littleton pilot projects based on a combination of factors, including the following:
- Speed and Traffic Data - Streets with high vehicle speeds or traffic volumes may be prioritized to improve safety.
Planned Roadway Improvements - Locations scheduled for repaving or restriping provide an opportunity to test safety enhancements efficiently.
- Crash History- Areas with a history of crashes, particularly those involving people walking and biking, may be chosen for safety interventions.
- Roadway and Land Use Context - Factors such as street width, number of lanes, nearby schools, parks, or businesses influence project selection.
- Community Feedback - Input from residents and stakeholders helps identify areas where safety concerns exist.
How long will construction last?
- Because the City uses quick-install materials for these projects, construction is typically completed within a few days. Larger projects, such as those spanning an entire corridor, may take multiple weeks . However, timelines can vary depending on weather conditions. The City's goal is to minimize disruption while making safety improvements as efficiently as possible.
Why does the City use plastic and rubber materials instead of concrete for these treatments?
- The materials the city uses for pilot projects are quick to install and moveable if we need to make revisions to the project design, all at a much lower cost than using concrete. These materials can be installed by City staff in a matter of days, as well as temporarily removed, if necessary, due to emergencies, heavy snow, or other conditions. Just like a seamstress would use a lower cost fabric to test how the project fits and adjust as needed before investing in a more durable, high-quality fabric, the city is first using lower-cost, quick-to-install materials to test and refine the design and materials before seeking to make them permanent.